Explainer · Prices
Inflation is not the price level
A rate can fall while the shelf stays high. The difference between those two facts explains most of the confusion in a grocery aisle.
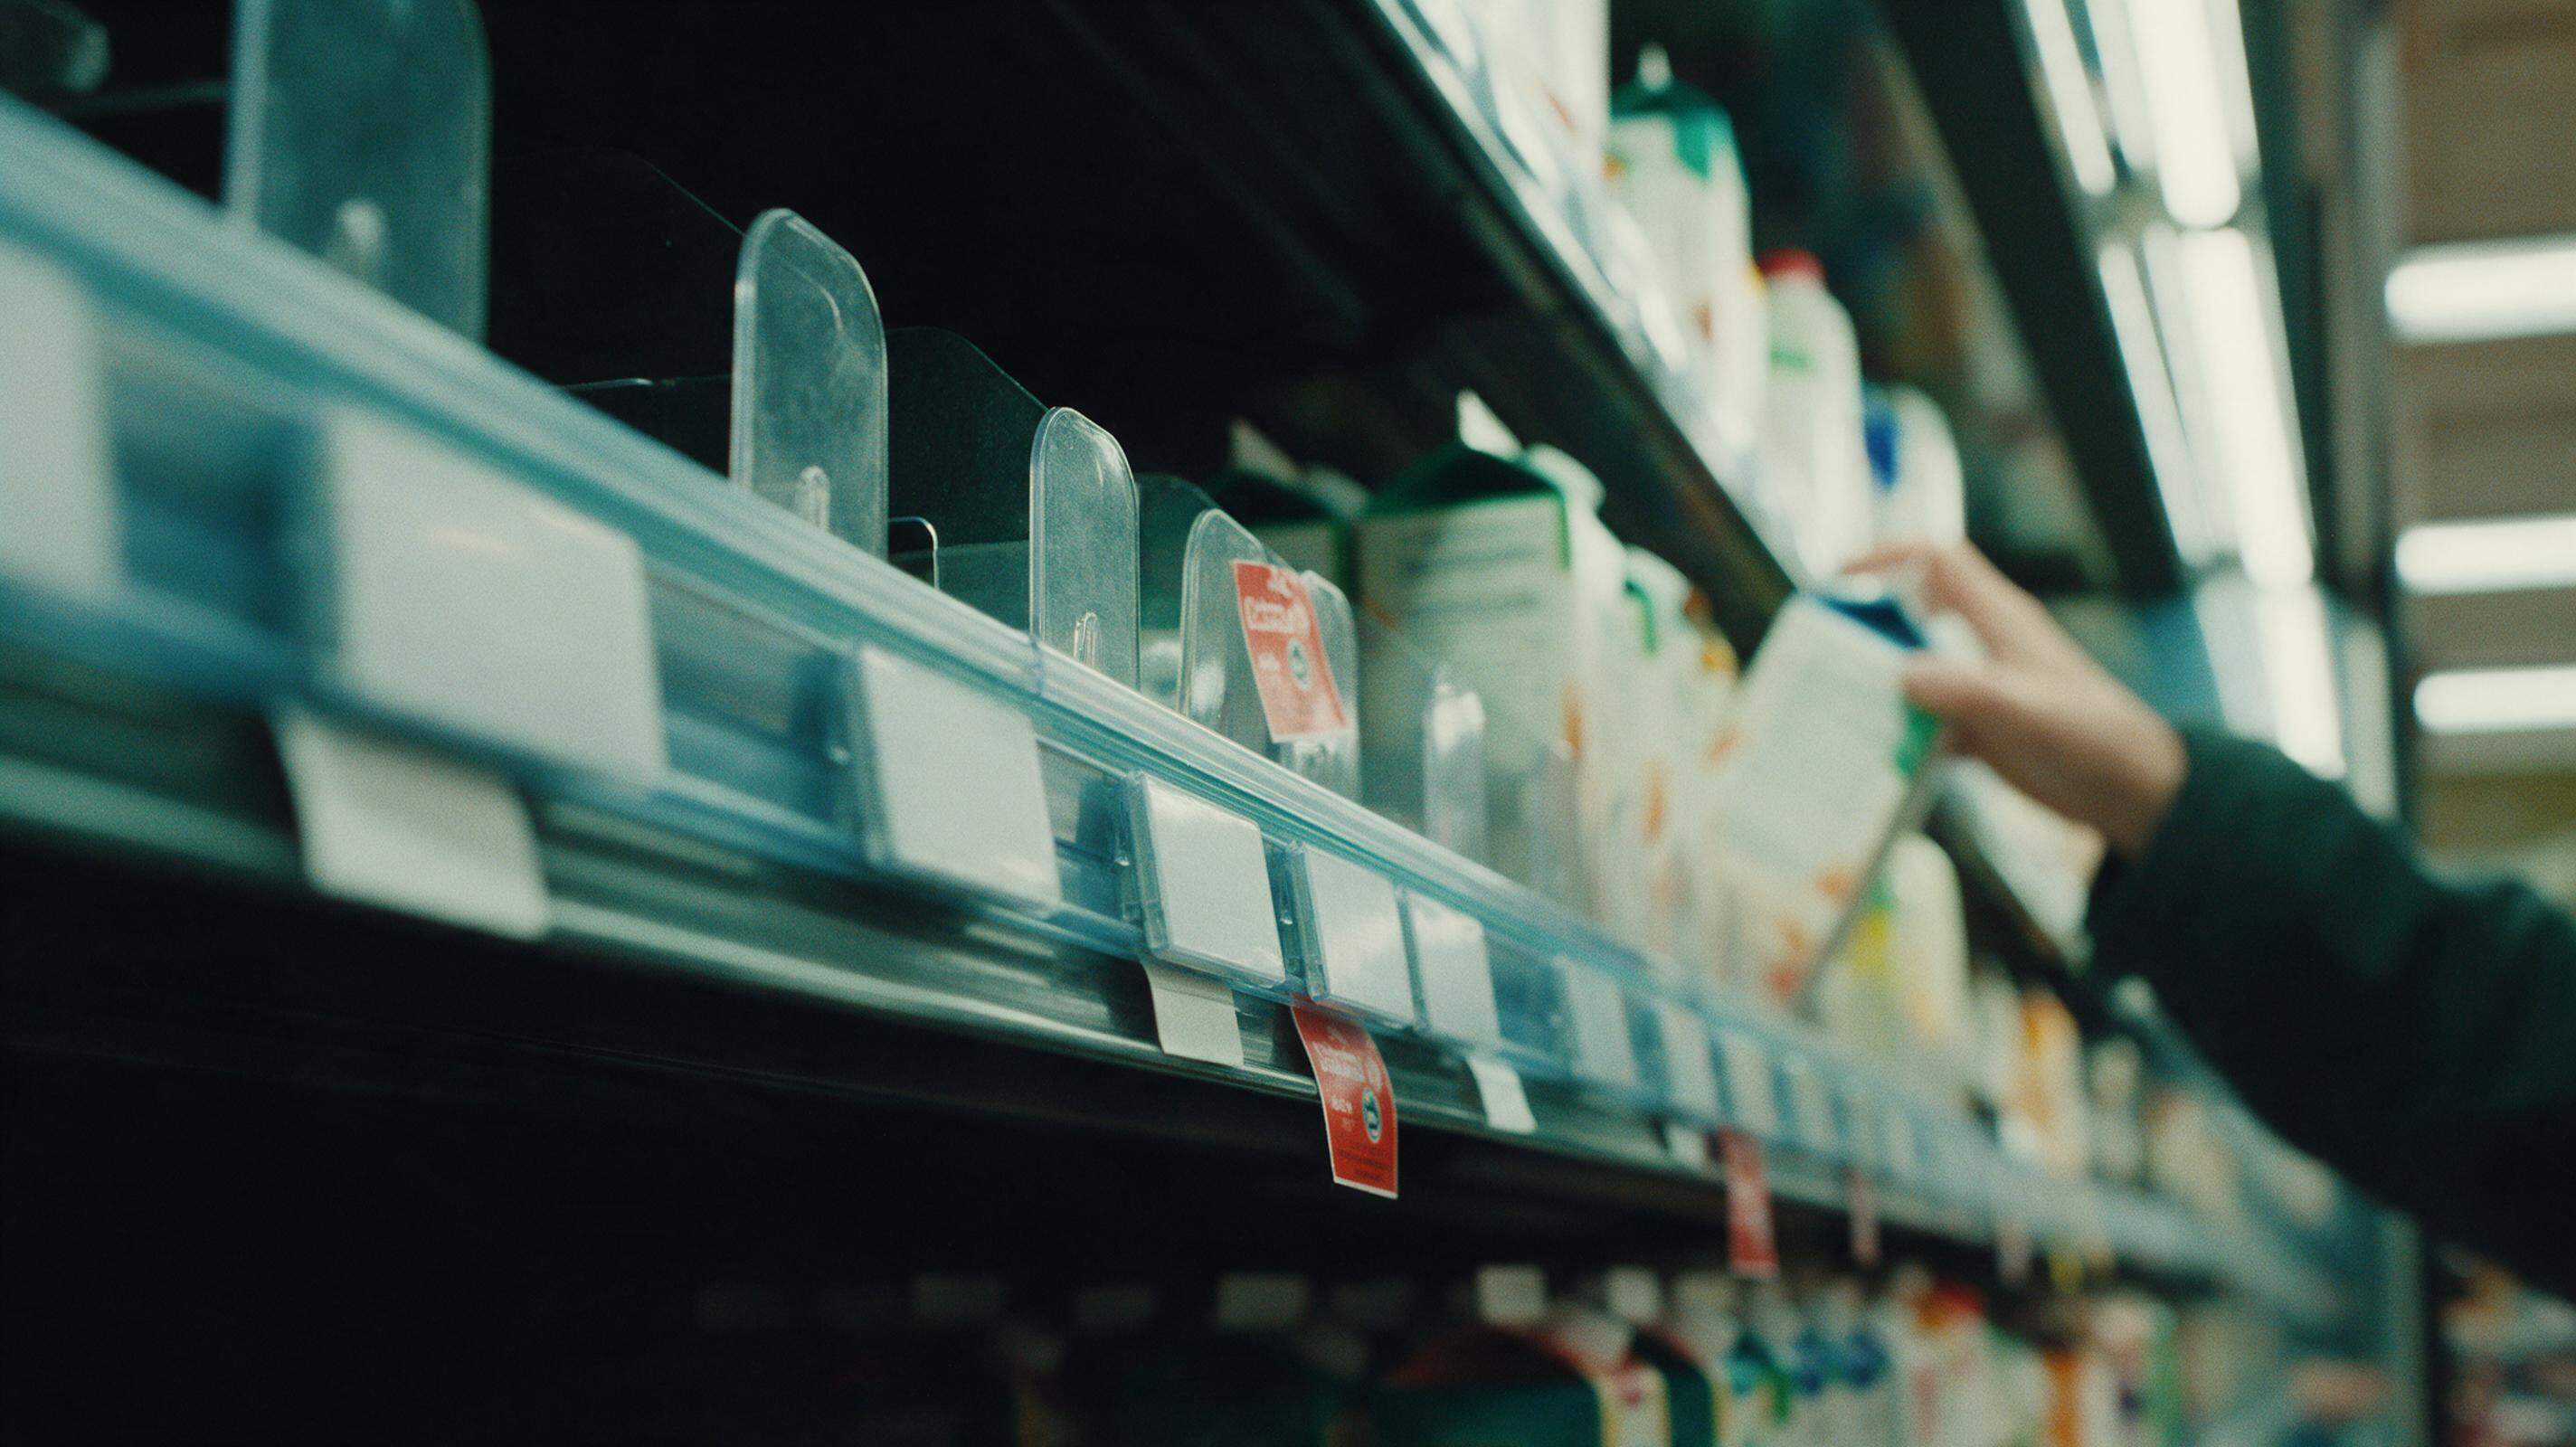
Groceries rose 1.7% in the year to September 2026. They are also 33.0% higher than they were in September 2020. Read quickly, those two sentences sound like a contradiction. Read carefully, they describe the same shelf.
The sentence that gets misread
Both numbers come from the same Statistics Canada release. They are both about prices. They answer different questions.
The first is a rate of change: what a fixed basket cost in September 2026 compared with September 2025. The second is a change in the price level: where that basket sits compared with a base period six years earlier. A rate can slow to its weakest pace since May 2024 while the level remains near a record. That is not a paradox. It is what a percentage does.
The rate is the slope. The index is the altitude.
Canada's Consumer Price Index is an index, not an average price tag. The all-items index is built from a fixed basket of goods and services and expressed relative to a base period, with 2002 set to 100. Each month, Statistics Canada prices that basket and publishes the change. The 12-month change is the headline; the monthly change is noisier and less quoted for good reason.
Prices for individual items fall all the time. In the year to September 2026, fresh vegetables fell 2.9% and sugar and confectionery fell 2.7%. A sustained fall in the general price level — deflation — is possible too, but it is a different event from a slower rise. Slowing inflation is still inflation.
Two numbers, two jobs
The September release carries several rates at once, and they tell different stories about the same month. The headline rose to 3.1% from 3% in August, led by gasoline. Excluding gasoline, the index rose 2.2%. Grocery price growth slowed to 1.7% from 2.8%.
| Measure | Change |
|---|---|
| All-items CPI | +3.1% |
| Excluding gasoline | +2.2% |
| Food purchased from stores | +1.7% |
| Groceries since September 2020 | +33% |
| Shelter | +1.8% |
| Rent | +2.8% |
| Transportation | +8.4% |
| Gasoline | +27.8% |
| Energy | +19% |
| Fuel oil and other fuels | +57.8% |
| Tuition fees, 2026 | +2.4% |
Source: Statistics Canada, Consumer Price Index, September 2026, released October 19, 2026. Grocery change since September 2020 and tuition for 2026 are as published in the same release. Table values are not a forecast.
None of those figures is the price of anything. Each is a comparison between two price levels twelve months apart. That is the whole job of a rate: to compress a comparison into a single number.
Here is what the arithmetic looks like. Suppose a fixed basket cost $100 in September 2025. At a 3.1% increase, the same basket would cost $103.10 a year later. If prices then rose 1.7% over the following year, the basket would cost about $104.85. The basket is more expensive in both years, even though the rate fell. This is illustrative arithmetic, not a forecast: it assumes the basket does not change and that the rates apply exactly.
What changes when the rate falls is the speed, not the direction. A loaf that rose from $3.00 to $3.09 and then to $3.14 has never once fallen in price. Its inflation rate did.
The grocery case
Groceries are the clearest place to see the distinction because they are bought often, in small amounts, by almost everyone. Since September 2020, food purchased from stores is up 33%. Over the past twelve months it is up 1.7% — the smallest yearly increase since May 2024, and the second consecutive month in which grocery price growth ran below the all-items index.
Statistics Canada is explicit that prices remain high despite the slowdown. That sentence contains both halves of the story. The annual rate has cooled. The level itself has not moved back.
Two numbers, one shelf
Statistics Canada, CPI
The level
Grocery price index, September 2020 = 100
+33.0% since September 2020
The rate
12-month change, September 2026
The rate slowed. The level did not.
Food is not a single price, either. Fresh vegetables, and sugar and confectionery, fell over the year, while fresh or frozen beef rose 8.7% — slower than August's 11.0%, but still a rise. A household buying beef and vegetables experienced a different grocery inflation rate from the one in the release. The average is a description of the basket, not a verdict on your receipt.
Why the average is not you
The CPI is a national average of household spending patterns. It is weighted, revised in method over time, and designed to represent the typical basket. It is not a bill, and it cannot be. Rent rose 2.8% in the year to September; gasoline rose 27.8%; fuel oil and other fuels rose 57.8%. The last of those had a greater impact on consumers in Atlantic Canada, where fuel oil is more widely used. The same national figure lands differently depending on how a home is heated.
There are two useful cautions when reading any headline rate. The first is weight: a large move in one component can dominate the index. Gasoline did that in September. The second is composition: renters and owners, drivers and transit users, students and retirees do not buy the same basket in the same proportions. A national average is a starting point for a household question, not an answer to it.
For a longer horizon, the Bank of Canada's inflation calculator converts a dollar amount between two years using monthly CPI data from 1914 to the present. It uses the formula cost₂ = cost₁ × (CPI₂ ÷ CPI₁) and reports the percentage change, the number of years and the average annual rate. It reflects the most recent month available, which is normally about two months behind the current month. It is a useful way to see that a price level is cumulative in a way a rate is not.
What to watch next
Statistics Canada lists the next CPI release in its official release calendar. Three questions are more useful than the headline alone. Is the all-items rate moving because of energy, or is the rest of the basket moving with it? Is grocery price growth still slower than the headline? Is shelter — and especially rent — decelerating or holding?
When the next release arrives, expect the same confusion to arrive with it. If the rate falls, someone will say inflation is over while the shelf stays exactly where it is. If the rate rises, someone will say prices are rising faster than they are. The rate is a slope. The level is the thing a budget has to carry.
The useful question is not whether inflation is back. It is what the basket costs now, what it cost the last time you bought it, and which parts of the basket you cannot avoid.
Sources
Source
Statistics Canada, Consumer Price Index, September 2026. Released October 19, 2026.
Read the releaseSource
Bank of Canada, Inflation calculator. Released Continuously updated; results reflect the latest CPI month.
Read the releaseBoreal Metrics does not publish forecasts or investment advice. Where a figure is corrected, the correction is noted on the page that carried it.